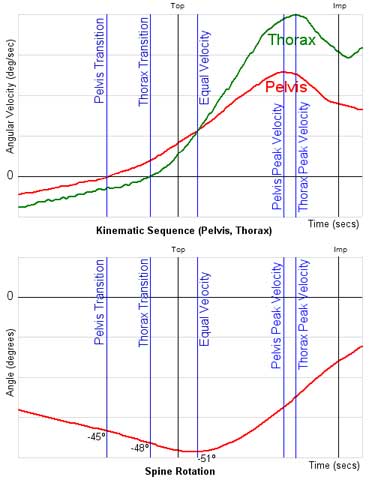
 Here is a detailed explanation of the pelvis and thorax kinematic sequence curves from TPI 3D, focused around transition. They display how transition occurs and there is a lot of information that can be gleaned from them. They relate directly to the spine rotation graph also. So for TPI 3D techies here we go.
The two above graphs have time in seconds along the X-axis and the specific parameter along the Y-axis, hence they show last part of backswing, top of backswing, downswing and impact. The red line in the kinematic sequence graph is the rotation velocity of the pelvis around its superior-inferior (up-down) axis. The green line is the same but for the thorax (ribcage). The red line in the second graph is the spine rotation angle in degrees (a.k.a. X-Factor). The first vertical black line indicates top of backswing (Top). The second vertical black line indicates impact (Imp). The vertical blue lines show other critical events during the swing and will be discussed:
Pelvis Transition: This vertical line indicates when the pelvis rotational velocity is zero. To its left both the pelvis and thorax segments have a negative value which means they are in the backswing. So for the pelvis this line indicates the exact point at which the pelvis is transitioning from backswing to downswing. Notice on the spine rotation graph that this is labeled as -45°; this means that when the pelvis transitioned there was 45°of “coil” between the pelvis and thorax, or the X-Factor was 45°. Also notice however that the green line, the thorax, is still negative; it is still in its backswing. So for the short period of time between the pelvis transition line and the thorax transition line the pelvis is in the downswing and the thorax is still in the backswing; they are moving opposite directions so the spine rotation angle keeps increasing (in the negative direction).
Thorax Transition: This vertical line indicates when the thorax rotational velocity is zero. At this point the thorax is now changing from backswing to downswing. The value for spine rotation at this point is -48°; so now there is 48° of spine coil (X-Factor). The spine coil has increased from 45° to 48°; so there is 3° of spine rotational stretch or X-Factor Stretch; but wait we are not finished yet; X-Factor is still stretching! This portion of the stretch so far is called the contra-directional stretch since “contra” means “opposite” and the pelvis and thorax were (until now) moving in the opposite directions. Notice at this point the thorax rotational velocity is zero and pelvis rotational velocity is positive; this means that the spine is still coiling and the X-Factor is still stretching. Notice that between thorax transition and the next critical point, the equal velocity line, the pelvis is moving faster than the thorax, so the X-Factor keeps stretching until the equal velocity point is reached. We call this portion of the stretch, ipsi-directional stretch, because “ipsi” means “the same” and in this phase the pelvis and thorax are moving in the same direction; they are both now turning in the downswing. At the equal velocity point the value of spine rotation is -51° in this example, so the spine coil has increased in this phase from 48° to 51°, so there is another 3° of X-Factor Stretch.
Equal Velocity: This vertical line indicates when both the pelvis and thorax are rotating in the downswing with the same rotational velocity. From this point on the thorax will be turning faster than the pelvis and the X-Factor will begin closing; X-Factor Stretch is done. This is shown by the spine rotation curve; it is now going up towards zero. So the total X-Factor Stretch is from pelvis transition to the equal velocity point and is the sum of both the contra and ipsi stretch values; in this case 3° + 3° = 6°.
Pelvis Peak Velocity: This vertical line indicates where the pelvis reaches its maximum turning speed during the downswing. Notice it is before the thorax peak and lower than the thorax peak. After this point it should rapidly decrease (decelerate) as it transfers speed to the thorax segment.
Thorax Peak Velocity: This vertical line indicates the point at which the thorax reaches its maximum turning speed during the downswing. In an efficient swing it should be larger than the pelvis peak and later than the pelvis peak, because it has received its “boost” from the pelvis segment and the “rotating” muscles of the spine and the abdomen. It also should then decelerate rapidly transferring its energy to the arm and eventually the club.